I’ve set myself a difficult task. To write about something that I don’t really understand. Networks in art, data patterns & unknown Inca mysteries… quite a mysterious title, ey? I don’t even really know where to start.
Oh yeah, this YouTube video introduced me to the mind boggling fact that seemingly random and completely desperate phenomena in the world can be calculated using the same fraction.
Drips from a tap & fluctuations in population….the exact same fraction. (Watch it as I definitely can’t explain it well)
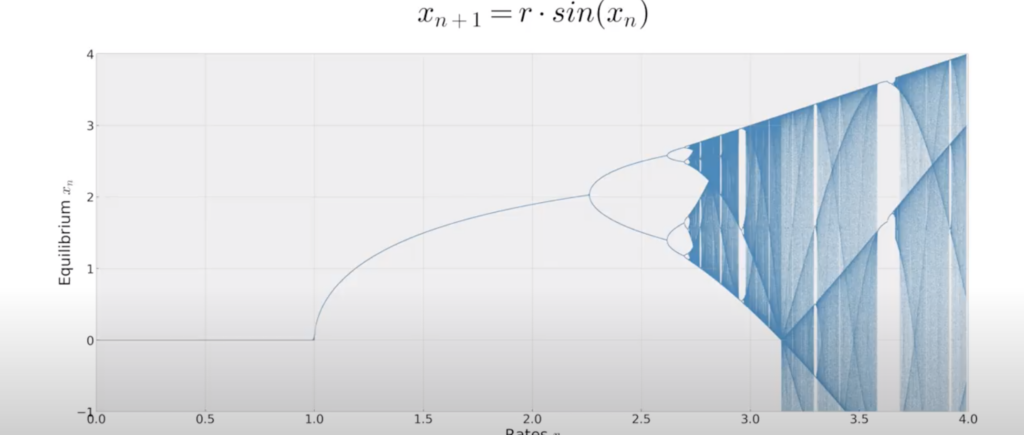
As well as enjoying listening to very smart people talking about very smart things, I also really like the beautiful data graphics that come from it – like the obscure side-ways mountain above.
A very tuned-in University lecturer introduced me to the Information Is Beautiful books, and thus picked this up about me before I realised it about myself (and my way of thinking), that I like systems and patterns and how data can be translated into 2D & 3D art.
But a few failed attempts at mapping patterns and translating them to knit and I didn’t follow its potential.
—
The next ‘mind-boggling – way too clever for me – interesting but I don’t really get it’ thing that it almost related is the natural order of life and space and micro bacteria = fractals.
This book blew my mind. The iChing & The Genetic Code.
Everything is fucking connected.
—
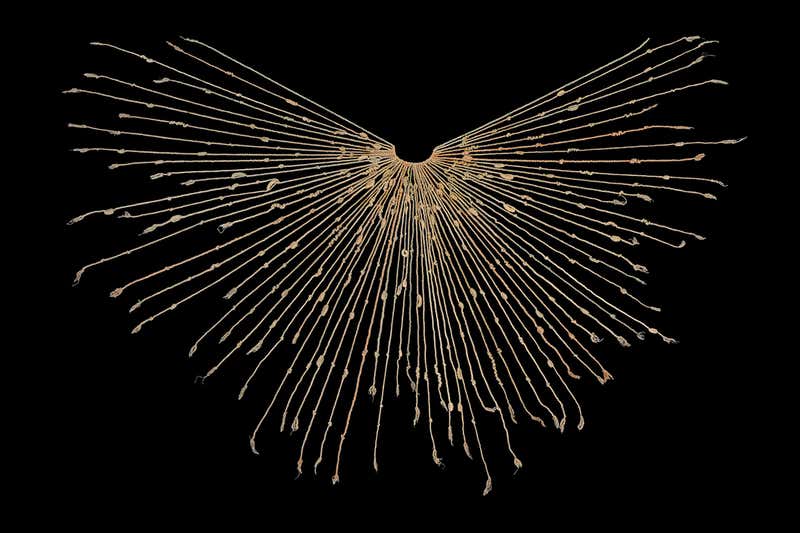
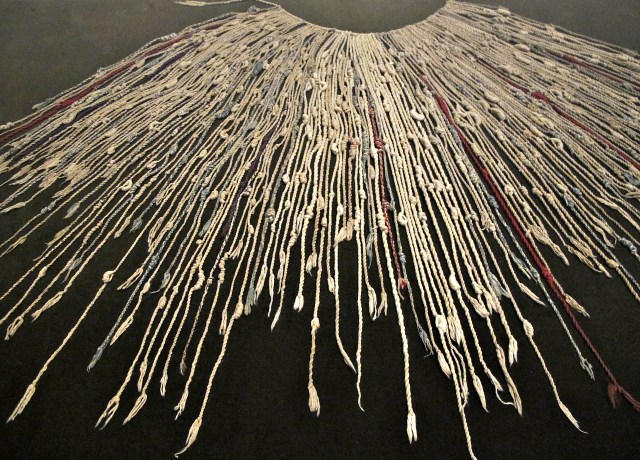
So I have started playing with fractals – using textiles, a yarn splitting basket technique and bits of plastic bags. It looks as Blue Peter as it sounds and nothing to write home about …(so the blog post is here why…) but within the chaos I see a glimmer of possibility so I will carry on.
But the networks created through the textile technique reminded me of two things.
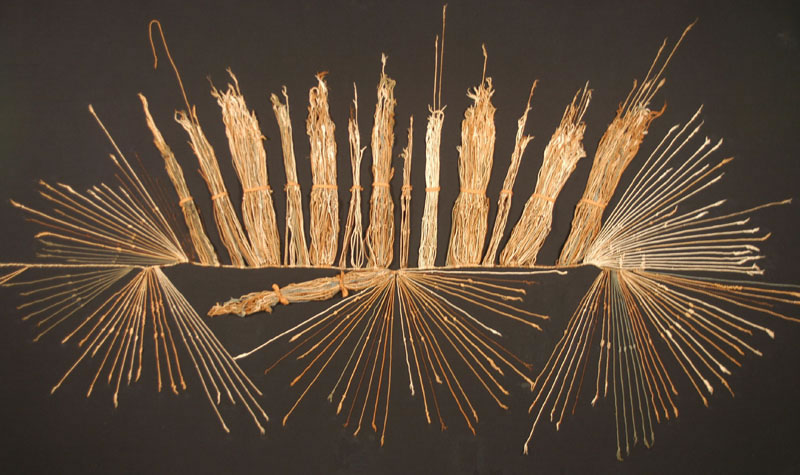
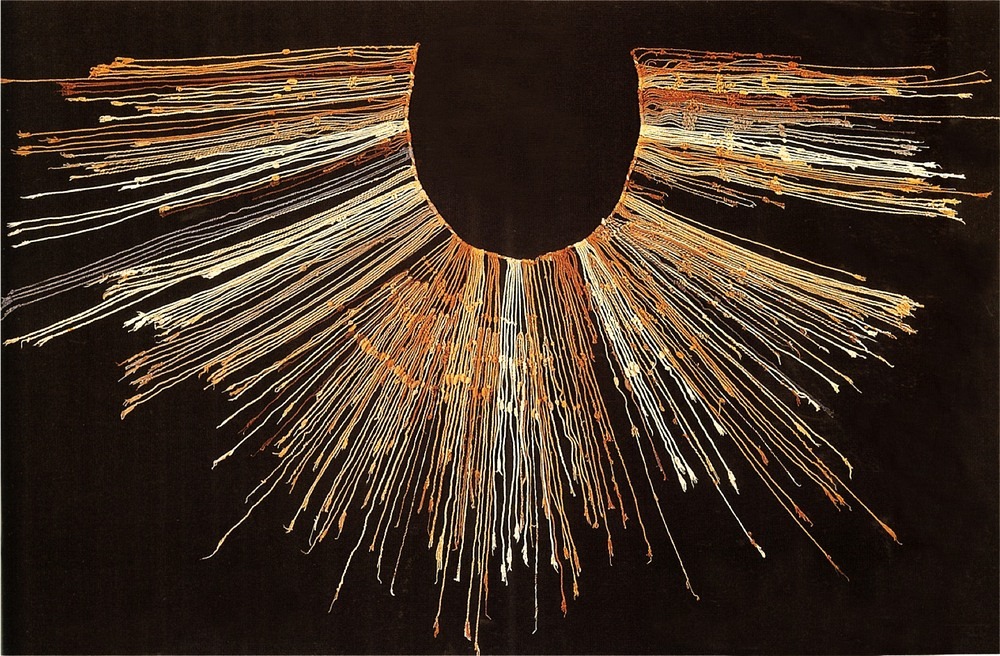
- The amazing ancient found knotted necklaces from the Inca period which hold secrets we will never understand, but prove that they were advanced in their civilisation and had reason to keep and count large amounts of data.
Inca Knots
2. Digital data imagery
I just listened to a really interesting online panel discussion held by the Serpentine, Hidden Patterns, and it reminded me of how much the visuals draw me in.
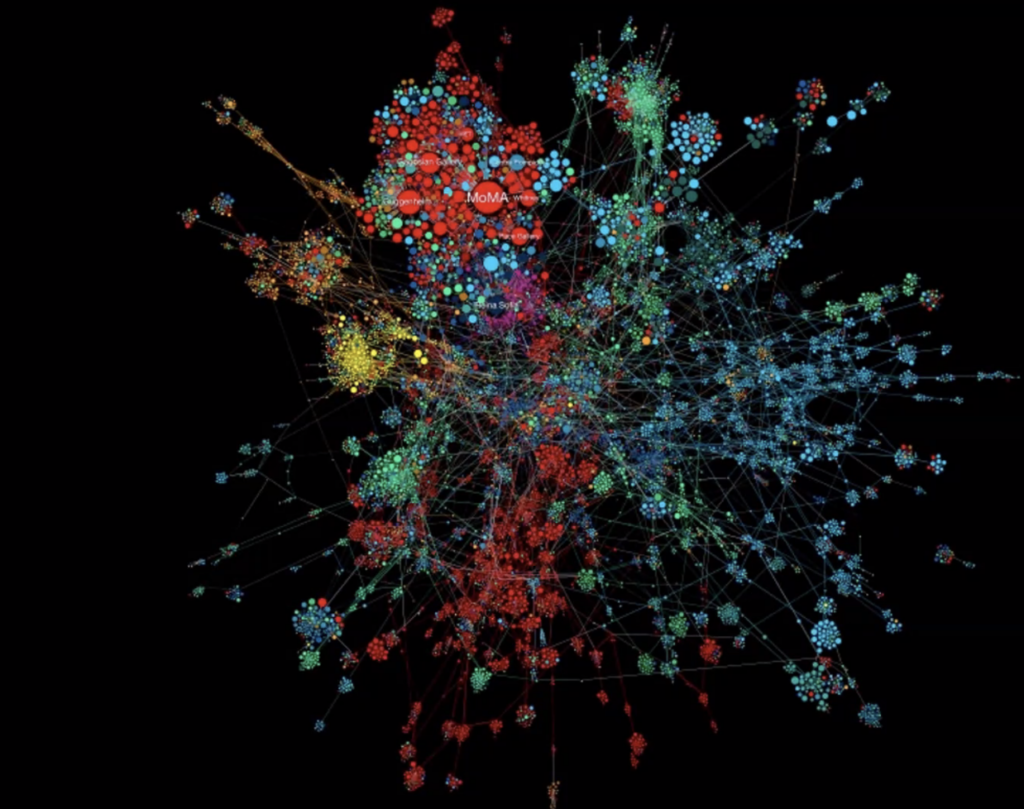
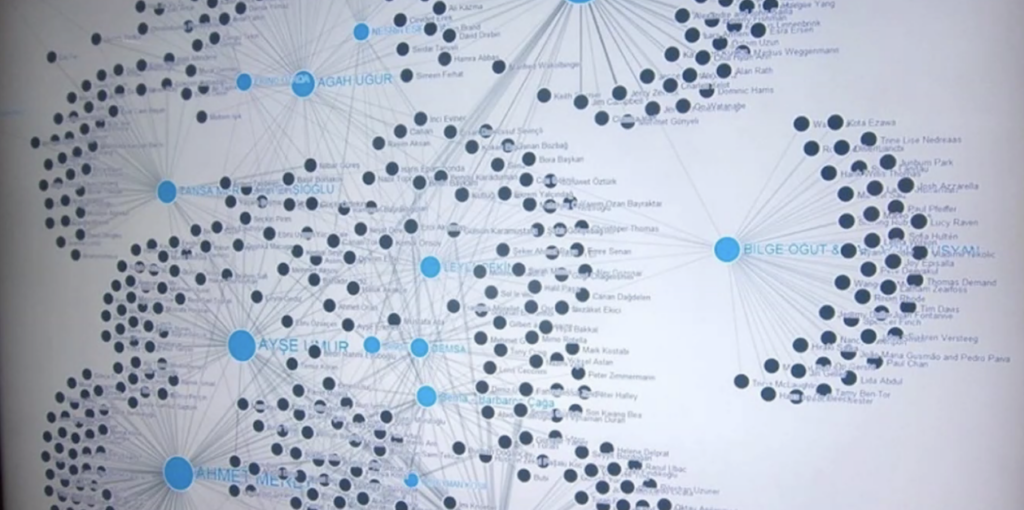
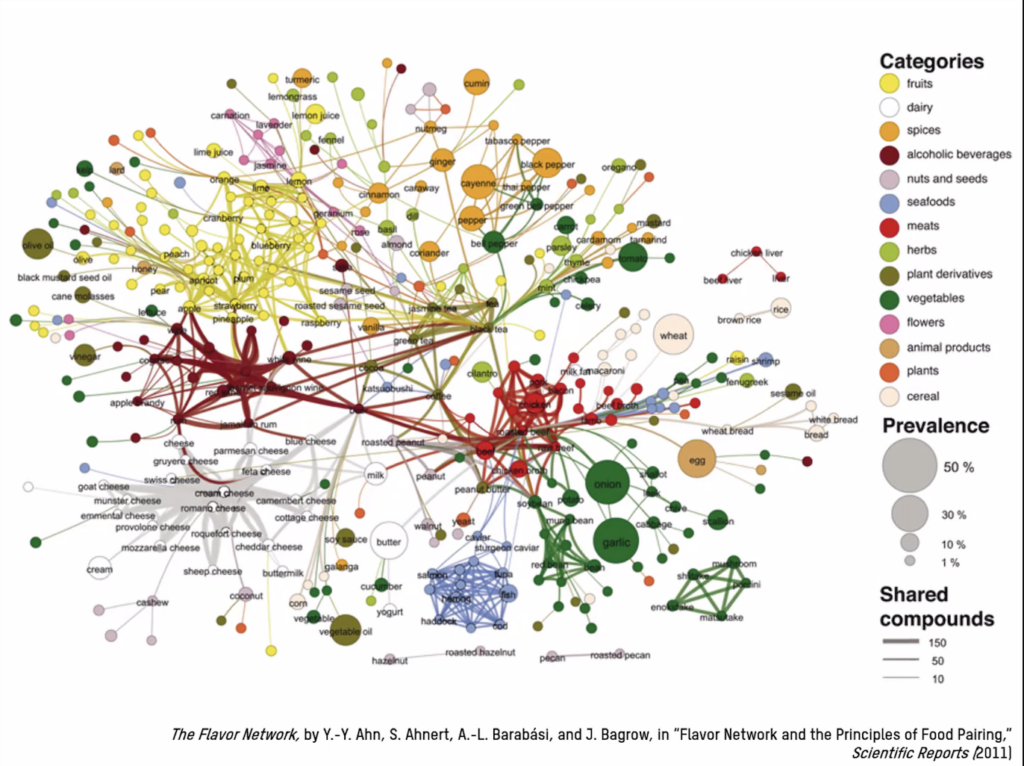
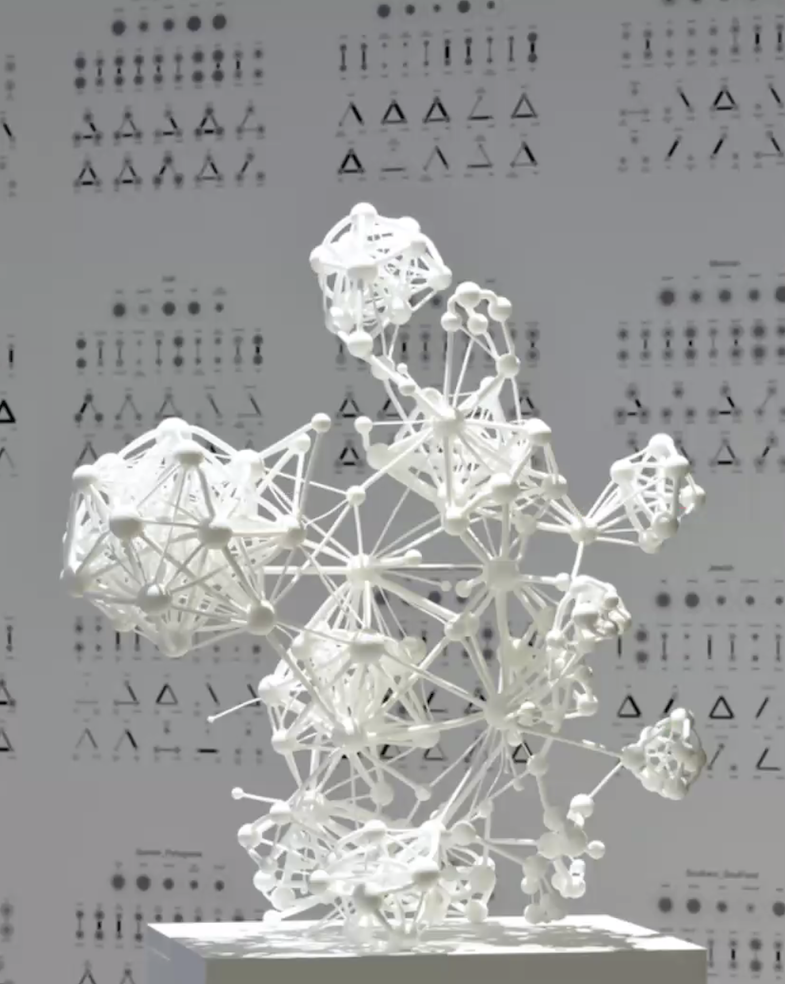
Images from slides by Albert-László Barabási & Burak Arikan
They talk about the content behind the aesthetics, the science, the actual data that the information is showing…. and I love the parallel between this and the Inca knots, these beautiful complex structures as a useful, 3D visualisation of the data they needed to keep a record of.
So after thinking about and looking at data visualisation, using the patterns of fractals and thinking about the shared visuals of all the parts that make up the world – human cells, bacteria, tree trunks, finger prints, weather patterns, maps of space – I feel a kind of awe, and I feel…difficult to explain, will come back to it.
But it brings forth the following questions –
- What would I want to record, in my life?
- What data is interesting and complex enough to produce rich results?
- Does it need to be collected data, can I just make it up or use already collected and organised data?
- Is this too big and complicated to even go in to?
- How can I simplify it to make it beautiful, like the Inca knots?